
Functional layers
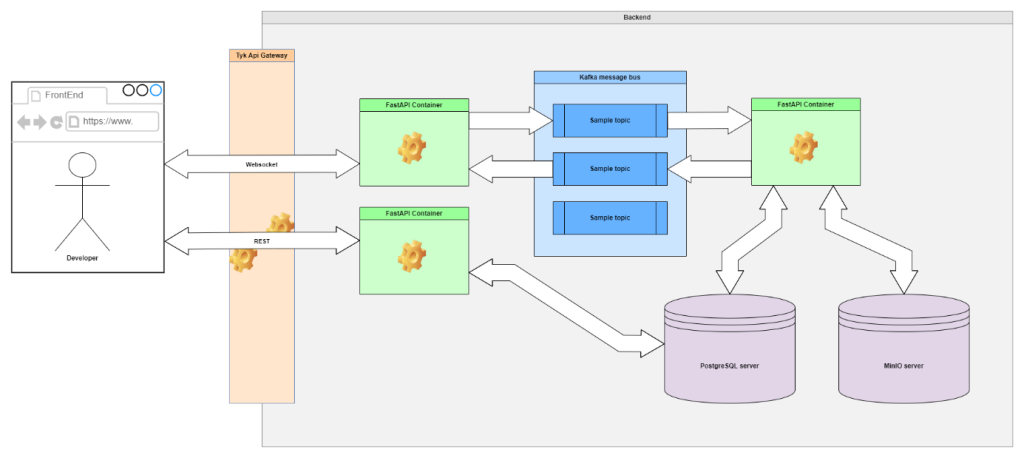
Systems operate based on a microservice architecture, which means their logic has been divided into independent, containerized components. User interaction with the application takes place from the frontend layer, via a web browser, where the developer – as the end user – can communicate with the system both synchronously and asynchronously. The two main protocols used for data transmission are REST and WebSocket. Both types of communication are handled by an intermediary layer, which is an API gateway component, implemented using the Tyk API Gateway solution.
Tyk API Gateway is a strategic infrastructure element responsible for receiving, authorizing, and forwarding HTTP and WebSocket requests to appropriate backend services. This solution supports advanced traffic management mechanisms such as rate limiting, token-based access control (JWT and OAuth2), response caching, and operational metrics and logs recording. The Tyk gateway is flexible in terms of integration with other components and well-adapted to container environments, enabling easy deployment and scaling.
In the backend layer, there are Docker containers with applications created using the FastAPI framework. FastAPI, being a modern, efficient, and asynchronous framework in Python, provides fast creation of RESTful services and support for WebSocket communication. Thanks to its structure based on typing and compliance with OpenAPI, it enables real-time API documentation generation and eliminates many errors resulting from data type inconsistencies. Each FastAPI service runs as a separate container, which corresponds to the principles of microservices – independence, individual scalability, and deployment capability.
The central element of communication between backend services is the Apache Kafka platform, which serves as a distributed message queuing system. Kafka has been implemented as a message bus, enabling asynchronous communication between services acting as data producers and consumers. In the architecture shown in the diagram, each FastAPI service can publish events to a specific topic, which are then subscribed to by other components of the system. This approach ensured separation of business logic from the communication layer, increasing system resilience to errors and allowing for flexible stream and batch processing.
Data in the system is processed and stored in two separate data repositories. Structural data, including for example information about users, configurations, operational states, or metadata, is stored in a PostgreSQL relational database. PostgreSQL offers full support for ACID transactions, advanced indexing mechanisms, replication and data partitioning, and extensibility through plugins and user functions. This database excels in environments requiring high data integrity and consistency.
Binary, unstructured data or data requiring high availability in an object model is stored in the MinIO system, which offers an interface compatible with Amazon S3. MinIO enables storing large amounts of data in the form of objects with assigned metadata, and also supports versioning mechanisms, encryption, and access policies at the level of individual resources. Due to its lightweight implementation and compatibility with cloud and on-premise tools, MinIO fits well with the needs of a flexible, scalable, and resilient data storage system.
The last backend component shown in the diagram is a FastAPI container acting as a data consumer from Kafka topics, whose task was to process incoming messages and save results to PostgreSQL or MinIO – depending on the nature of the processed data. This operational model allowed for implementing stream processing mechanisms, where data was received and analyzed in real-time, and batch processing, where data was collected and processed periodically.
Monitoring
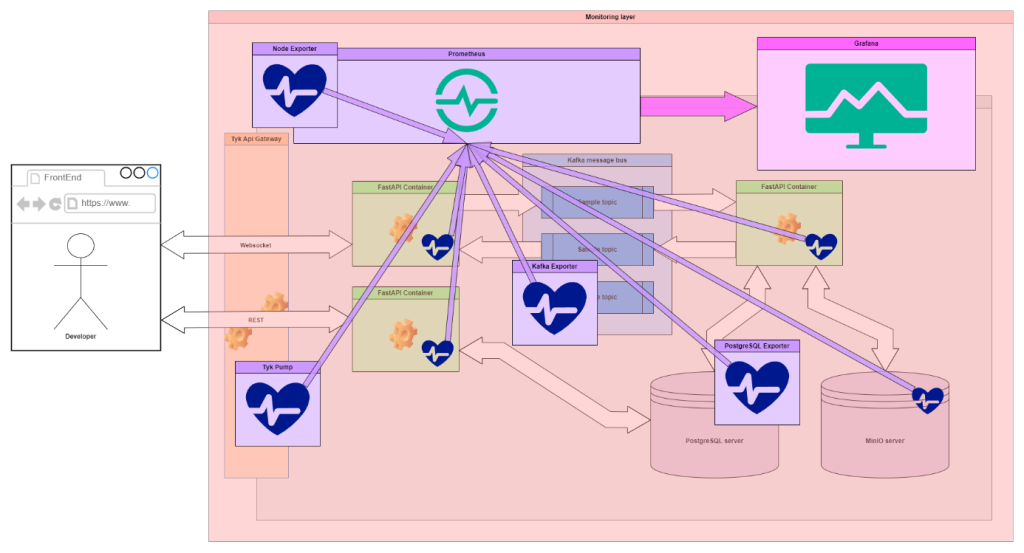
The central element of the monitoring layer is Prometheus, which serves as a metrics collection system. It is an open-source tool designed for monitoring containerized applications and microservice environments. Prometheus operates on the principle of active data scraping, which means that at regular intervals it queries configured endpoints that export metrics in a special text format. The advantage of this approach is the decentralization of responsibility for data provision – each service must independently expose an appropriate endpoint, which increases transparency and configuration flexibility. Prometheus aggregates time-series data, enabling its retention, searching, and correlation over time.
The sources of metrics are various exporters that have been placed in appropriate logical locations of the system. To monitor basic infrastructure resources such as CPU usage, RAM memory, disk space, or operating system load, the Node Exporter component was used. This exports system metrics from the host level on which containers are running and allows for the identification of potential bottlenecks at the physical level.
For FastAPI containers that handle business logic, appropriate endpoints with metrics compatible with the Prometheus format have been implemented. These metrics may contain information about response time, number of requests handled, HTTP status codes, as well as system resource usage by a given service. This approach enables detailed observation of the condition of microservices and rapid detection of anomalies in their operation.
To ensure monitoring of the intermediary layer, the Tyk API gateway, the Tyk Pump tool was used, which serves as an exporter of operational metrics collected by the Tyk Gateway. It includes metrics related to the number of requests, throughput, delays, and errors, which is crucial from the perspective of security and access control.
For monitoring the Apache Kafka message queuing system, a dedicated Kafka Exporter was used, which enables collecting data about the number of messages in individual topics, consumer delays, error rates, and processing time. This makes it possible to identify overloads or problems with real-time event processing, which forms the basis for optimizing an event-based system.
For the database layer, a separate PostgreSQL Exporter was used, which enables collecting metrics related to SQL query performance, number of connections, response time, resource usage, and the state of indexes and transactions. Similar metrics can also be collected from the MinIO object, which exposes its own diagnostic data enabling assessment of response time, resource availability, and number of queries.
The data collected by Prometheus is then visualized in the user interface of the Grafana system, which enables creating dynamic dashboards, charts, and alerts. Grafana acts as a frontend for data collected by Prometheus, offering an extensive PromQL query language and mechanisms for authentication and access control to visualization panels. Thanks to integration with Prometheus, it is possible to define alert rules that, in case of detecting thresholds being exceeded, can trigger email notifications, webhooks, or send messages to external systems such as Slack.
The monitoring layer has been embedded in a separate logical domain, which allows for its independent management and scaling, and also ensures isolation from the critical business logic of the system. Such separation also facilitates integration with external infrastructure supervision systems and allows for centralization of logging and alerting in larger production environments.